
So far we have used Lua to prepare exams, practice sheets and worksheets. With the latest version we can go one step further: ask the assistant to look up data from a public body and use it to write an evidence-based report, that is, a report in which every conclusion rests on figures and charts that anyone can check.
The sources can be very varied: Spain’s National Statistics Institute (INE), the Galician Statistics Institute (IGE) or datosclima.es, which collects the records of the AEMET weather stations. In this article we use the latter to answer a question that works really well in class: does the data from a nearby weather station show climate change?
Step by step
Step 0. Install or update Lua
This feature is only available in the most recent versions. Download the latest one from the Lua releases page on GitHub (26.11.1 at the time of writing) and install it over the one you have.
Step 1. Create a project
As we saw in other articles, a project is simply the folder where Lua keeps the information. Create it and choose which folder on your computer it will be saved in.
Step 2. Create a form with the assistant
Click the project’s Open button and create a new form with the assistant.
Step 3. Add a long text field and save the form
A report is a long piece of text, so a single long text field is enough. Save the form with a name that identifies it, for example Vimianzo Climate.
Step 4. Ask the Data assistant for the report
Click Data assistant and type the request. We used this one:
Prompt
Using the data stored at https://datosclima.es/, recorded by the Vimianzo weather station, I want you to write a report showing how temperatures changed from 2000 to 2026, using whatever charts are needed, in order to check whether climate change can be confirmed over these years.
Notice that the prompt states three things: where the data comes from (the source and the station), which period is studied and what the report is for. The more specific the request, the more useful the result.
The result
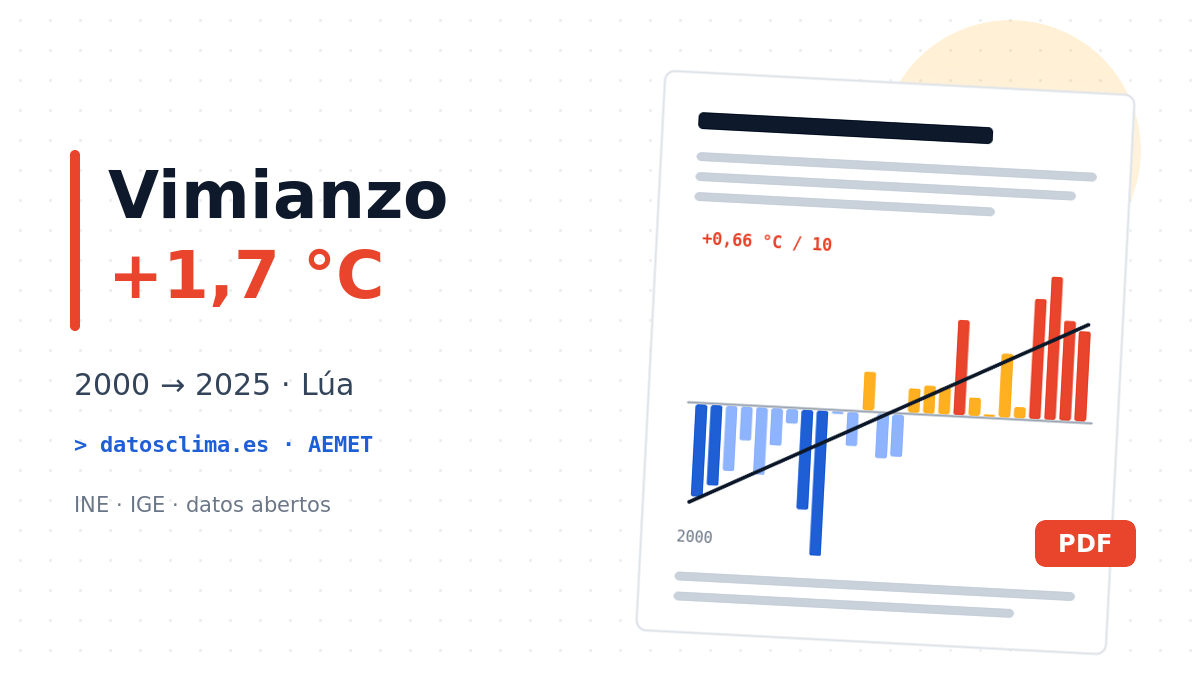
The assistant looked up the series for the Vimianzo station (AEMET code 1399), calculated the annual averages, drew the charts and reached a clear conclusion: with this data, yes, warming can be confirmed. Some of the findings:
- The mean temperature rises by +0.66 °C per decade, about +1.7 °C between 2000 and 2025.
- Comparing periods: 12.46 °C (2000–2009), 13.10 °C (2010–2019) and 13.74 °C (2020–2025).
- The warming is almost entirely in the minimum temperatures: nights are warming about five times faster than days.
- All eleven years from 2000 to 2010 are below the average; the six warmest years are between 2017 and 2025.
- 2026 is not over yet, so the report treats it separately instead of mixing it into the series.
You can read the whole report here or download the PDF:
An evidence-based report also says what it doesn’t know
The report itself ends with a section of caveats: it is a single station, 26 years is a short period to talk about global climate, and recent data only goes through automatic quality checks. That honesty is part of the value of the exercise. Even so, always check a few figures against the original source: AI can make mistakes, and checking is exactly what we want to teach.
Ideas for the classroom
- Compare stations: each group asks for the same report for another station (Santiago, Cabo Vilán, Fisterra…) and they compare the conclusions.
- Read charts critically: what does a moving average mean? Why separate maximums and minimums? Why can’t 2026 be compared with complete years?
- Other sources, other questions: with INE or IGE data you can study how the population of your town has changed, ageing or unemployment, always with the same pattern: source, period and purpose.
The point is not for the machine to answer for us, but to give us back a document with verifiable data to discuss. And in the classroom, that is worth its weight in gold.